
The fastest way to produce a usable app revenue estimate is to multiply estimated downloads by a revenue-per-download (RpD) benchmark, then cross-check that number against store ranking signals and at least one external dataset. Three steps to get there quickly:
- Quick DIY calc: Pull the app's category rank from the App Store or Google Play, map it to a download range using a rank-to-download curve, then multiply by an RpD benchmark for that category and monetization type.
- Store signals to check: Category rank position, ratings volume and velocity, price tier, and update frequency all correlate with download and revenue trajectory.
- When to buy a provider's estimate: If the decision involves capital allocation, M&A due diligence, or a UA budget above $50K, pay for a tool like APPRICER or a panel-backed dataset. For quick competitive scans, a DIY estimate is usually sufficient.
The global app market continues to grow in total revenue even as download volumes plateau in mature markets, which means RpD benchmarks are rising in categories like productivity and health. Getting the monetization mix right matters more than ever.
Key Takeaways
Reliable app revenue estimates require the right formula, market-specific inputs, and validation across at least two independent sources before any capital decision.
| Point | Details |
|---|---|
| Core formula | Multiply estimated downloads by a category-specific RpD, then deduct store commissions to get developer proceeds. |
| U.S. iOS specificity | Apply U.S.-specific RpD benchmarks, not global averages; U.S. iOS revenue per download is typically 2–4× the global figure. |
| Accuracy by app size | Top-chart estimates run ±10–15%; apps below 10K monthly downloads carry ±50% or more uncertainty. |
| Validation rule | Triangulate across at least two independent sources; a gap larger than 30% signals a monetization mix or data assumption problem. |
| APPRICER | Provides current iOS pricing, subscription, and revenue trend data across 175 countries to sharpen RpD inputs for U.S. iOS estimates. |
Table of Contents
- How commercial estimators actually build download and revenue models
- What data actually feeds into download and revenue estimates
- The formulas every estimator uses — and the benchmarks behind them
- How to estimate an app's revenue yourself, step by step
- Accuracy bounds, blind spots, and how to validate your numbers
- How to choose a paid estimation provider
- How to use revenue estimates for real decisions
- How APPRICER sharpens your U.S. iOS revenue estimates
- The estimation mistake most analysts make
- APPRICER gives you sharper U.S. iOS revenue inputs
- Sources
How commercial estimators actually build download and revenue models
Most providers don't just count visible signals. They train models on a combination of observable store data and ground-truth revenue figures from publisher disclosures, SDK panels, and backtests. The architecture typically falls into three tiers.
Rule-based heuristics are the simplest: assign a download range to each rank bucket, multiply by a fixed RpD. Fast, transparent, and wrong for anything outside the top 200.
Regression models add more inputs — ratings count, price, update cadence, category — and fit coefficients against known revenue data. Better for mid-tier apps, but they assume relationships stay stable over time.
Machine-learning and ensemble models combine dozens of signals and retrain regularly. They handle non-linear relationships (a free app with aggressive IAP can massively outperform a paid app at the same rank) and are what serious commercial providers use today.
What goes into the model
Typical inputs include:
- Store ranking history across category and overall charts
- Visible install counts (Android only, where Google exposes ranges)
- Price tier and in-app purchase configuration
- Ratings count, average rating, and review velocity
- SDK footprints detected via app binary analysis
- Ad network impression signals and CPM data
- Device-level panel data from opted-in user samples
- Publisher disclosures and public financial filings for ground-truth calibration
What data actually feeds into download and revenue estimates
No single source gives you the full picture. Providers combine several streams, each with real trade-offs.
- Store metadata and public charts: Free, always fresh, and available for both the App Store and Google Play. The limitation is that rankings are ordinal, not cardinal — rank 10 in Productivity tells you relative position, not absolute downloads.
- SDK and binary-signature panels: Providers scan app binaries to detect which SDKs are embedded (analytics, ad networks, payment processors). This reveals monetization infrastructure without requiring any data from the developer. Coverage skews toward apps large enough to attract panel attention.
- Ad network impression and CPM data: Some providers partner with ad networks to get aggregated spend and impression data. Useful for estimating ad revenue, but coverage is uneven and often excludes direct deals.
- Device-level panels: Opted-in user samples that report actual app usage and purchase behavior. The gold standard for accuracy, but panels are expensive to maintain and tend to underrepresent niche or regional apps.
- Public company disclosures and SEC filings: The most reliable ground-truth available. A publicly traded developer's 10-K or earnings call gives exact revenue figures that providers use to calibrate their models. The problem: only a small fraction of apps come from public companies.
- Third-party aggregators: Sources like Statista's mobile monetization hub provide category-level ARPU benchmarks and market-size figures useful for sanity-checking estimates at scale.
U.S. iOS coverage is typically the strongest across all provider types. The App Store's chart transparency, the concentration of high-value publishers in the U.S., and the density of panel users in English-speaking markets all combine to make U.S. iOS estimates more reliable than, say, Southeast Asian Android estimates.
Privacy and legal constraints cap what providers can collect. No provider legally uses personally identifiable information. All panel data is aggregated and anonymized before it enters a model. GDPR and CCPA compliance means some behavioral signals available five years ago are no longer accessible, which is one reason model accuracy for niche apps has gotten harder, not easier.
Pro Tip: When evaluating a provider, ask specifically whether their panel covers U.S. iOS users and what the panel size is. A provider with 500K opted-in U.S. iOS panel users will produce materially different estimates than one relying primarily on store-rank heuristics.
The formulas every estimator uses — and the benchmarks behind them
Five metrics do most of the work in any app revenue model. Here's how they connect.
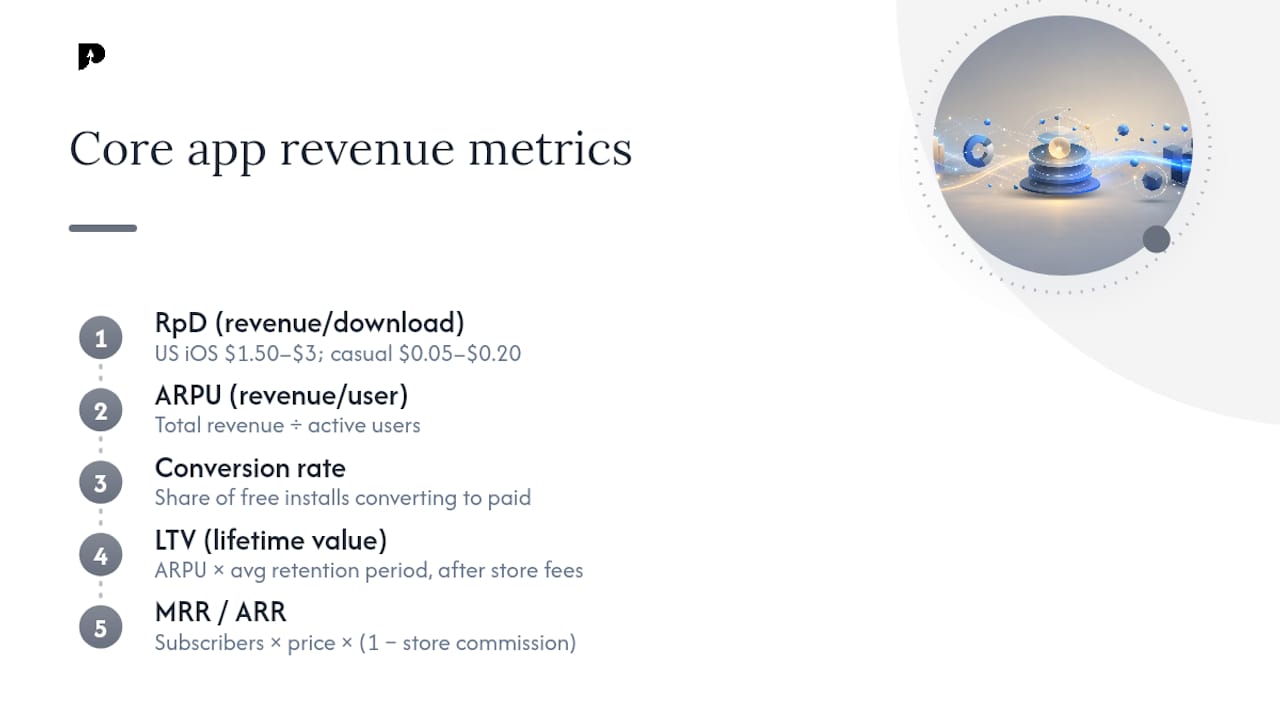
Revenue per download (RpD): Total revenue ÷ total downloads over a period. The single most useful number for quick estimates. RpD varies enormously by category: a U.S. iOS meditation app might run $1.50–$3.00, while a casual game runs $0.05–$0.20.
ARPU (average revenue per user): Total revenue ÷ active users. More useful than RpD when you know your DAU or MAU, because it strips out the install-to-activation gap.
Conversion rate: The share of free installs that convert to a paid tier or subscription.
LTV (lifetime value): ARPU × average retention period, after deducting store commissions. Revenue Map's financial model makes the point clearly: LTV calculated on gross revenue is misleading.
MRR/ARR: Monthly (or annual) recurring revenue. For subscription apps, MRR = active subscribers × average subscription price × (1 − store commission).
Benchmarks sourced from Adapty's revenue guide; actual figures vary by category, price point, and UA quality.
Worked example 1 — U.S. iOS subscription app: Estimated monthly downloads: 50,000. RpD: $1.20. Estimated monthly gross revenue: $60,000.
Worked example 2 — U.S. Android ad-supported app: Estimated monthly downloads: 200,000. RpD: $0.08 (ad-driven). Estimated monthly gross revenue: $16,000. Google Play's fee documentation explains exactly how store fees and taxes interact with developer earnings.
Use RpD for quick UA budgeting and competitive benchmarking. Switch to cohort LTV for valuation work or when modeling the impact of retention improvements. Adapty's guide recommends D60 revenue-per-install as the most predictive single metric for long-term app financial performance.
How to estimate an app's revenue yourself, step by step
This workflow produces a defensible estimate in under an hour for most U.S. iOS apps.
- Find the app's category rank. Check the App Store's top charts for the relevant category. Note both the overall rank and the category rank.
- Map rank to a download range. Use a rank-to-download reference. Top 10 in a major U.S. category typically means 5,000–30,000 daily downloads; rank 50–100 is roughly 500–3,000 daily.
- Identify the monetization model. Is it free with IAP, subscription, paid upfront, or ad-supported? Check the app's store listing, pricing tab, and any visible subscription options.
- Select an RpD benchmark. Match the app's category and monetization type to a benchmark range. Use conservative, mid, and aggressive values for your three scenarios.
- Apply a country weight. For a U.S.-focused estimate, weight U.S. downloads at 40–60% of total iOS downloads for English-language apps. Multiply by U.S.-specific RpD (typically 2–4× the global average).
- Compute revenue bands. Multiply each scenario's download estimate by its RpD. This gives you a low/mid/high revenue range.
- Sanity-check against visible signals. Does the revenue band make sense given the app's ratings volume, update frequency, and apparent UA spend?
Worked U.S. example: A productivity app sits at rank 35 in its U.S. App Store category. Estimated daily downloads: 1,200. Monthly downloads: ~36,000. Monetization: subscription, $9.99/month. RpD scenarios: low $0.80, mid $1.40, high $2.20.
Pro Tip: D7 retention is the earliest reliable predictor of long-term LTV in subscription apps. Use D7 data to pressure-test your RpD assumption before committing to a UA budget.
Accuracy bounds, blind spots, and how to validate your numbers
No estimate is exact.
Common blind spots:
- Long-tail apps: Models trained on top-chart data perform poorly on apps with fewer than 10,000 monthly downloads. There's simply not enough signal.
- Sudden UX or monetization changes: A paywall redesign or price change can shift RpD dramatically within weeks. Historical estimates won't reflect it.
- D2C and web payment flows: Revenue from a developer's own website or external billing bypasses the store entirely. Adapty notes that web payments carry 2–5% fees versus the 15–30% store cut, which means apps with strong D2C flows are systematically underestimated by store-signal models.
- Ad revenue invisibility: Ad revenue is rarely visible in store signals. Providers estimate it from SDK detection and CPM benchmarks, but direct ad deals are completely opaque.
- Geography-specific pricing: Apps using local pricing (lower prices in emerging markets, higher in Japan or Switzerland) will have distorted global RpD figures if the model doesn't account for country-level price variation.
Validation checklist:
- Compare estimates from at least two independent sources or methods
- Look for any public publisher disclosures (earnings calls, press releases, app store awards)
- Ask a provider whether their estimates have been backtested against known revenue figures and what the sample size was
- Check cohort revenue curves: does the estimated MRR trajectory match the app's visible ratings growth?
- For publicly traded developers, cross-reference with SEC filings
| App size | Typical accuracy range |
|---|---|
| Top 10 in major category | ±10–15% |
| Rank 10–100 | ±15–20% |
| Rank 100–500 | ±25–35% |
| Below 500 or <10K monthly downloads | ±50% or more |
How to choose a paid estimation provider
Not every provider is worth the price. Here's what to evaluate before committing.
Buyer checklist:
- Data sources and sample size: Does the provider use panel data, store signals only, or both? What's the panel size for U.S. iOS specifically?
- Platform and country coverage: Does it cover both iOS and Android? How deep is U.S. coverage versus global?
- Revenue types included: Does it estimate IAP, subscriptions, paid installs, and ad revenue separately? Or does it lump everything into one figure?
- Methodology transparency: Does the provider publish a "how we estimate" document? Can you request a sample accuracy report?
- Backtesting and accuracy claims: Has the provider validated estimates against known revenue figures? What was the sample size and error range?
- API and export access: Can you pull data programmatically for your own models? Is CSV export included?
- Update frequency: How often does the underlying dataset refresh? Weekly is the minimum for fast-moving categories.
- Pricing model: Is it per-app lookup, subscription, or enterprise contract? Does cost scale with usage?
Panel-backed providers (those combining device-level panels with store signals) tend to outperform store-signal-only providers for top-chart apps, but the gap narrows for mid-tier apps where panel coverage thins out.
- Use a paid provider when the decision involves capital (M&A, large UA budgets, investor decks) and you need defensible numbers with a stated methodology.
- Use a DIY approach for quick competitive scans, early-stage product decisions, or when you're triangulating against a paid estimate to check for outliers.
- Use both when the stakes are high: run your own model, buy a provider estimate, and flag any gap larger than 30% as a signal to investigate the monetization mix or data source assumptions.
How to use revenue estimates for real decisions
Estimates become useful only when you match the right metric to the right decision.
UA budgeting and CPA targets: Use RpD as your anchor. If your target app category shows a mid-case RpD of $1.20 on U.S. iOS, your maximum allowable CPA for a breakeven campaign is $1.20 before store fees. Build your bid strategy around that floor, not the gross figure.
Early-stage valuation and investor decks: Switch to LTV and MRR. Investors want to see a cohort model that shows how revenue compounds as retention holds. A Revenue Map financial model that explicitly deducts store commissions and models churn is far more credible than a flat RpD projection. Use conservative assumptions for the base case and show sensitivity to D30 retention, because that's the variable investors will stress-test first.
Product roadmap and pricing decisions: ARPU by feature or subscription tier is the right lens here. PocketGamer's H1 2026 data shows IAP revenue dipped 2% while gaming ad spend grew 8% to $7 billion, which means the monetization mix assumption you made 18 months ago may already be stale.
One firm caution: revenue estimates are for strategic decision support only. Never use them as the basis for tax filings, legal agreements, or regulatory submissions. Those require actual reported figures.
How APPRICER sharpens your U.S. iOS revenue estimates
APPRICER focuses specifically on iOS apps across 175 countries, which makes it particularly useful for the U.S. iOS estimates that matter most to developers and growth managers.
Key capabilities:
- Searchable pricing and subscription database: Browse iOS app prices and subscription configurations across categories to see exactly what competitors charge, which tiers exist, and how pricing has shifted over time.
- Revenue trend signals: Track which apps are growing in revenue contribution, not just downloads, so you can update your RpD assumptions with current market behavior rather than stale benchmarks.
- Competitor pricing detection: Spot when a competitor changes its price tier or introduces a new subscription product, which is often a leading indicator of a monetization strategy shift.
- Niche identification: Find categories where subscription revenue is growing faster than download volume, a signal that RpD is rising and the market is maturing.
- Export and API access: Pull pricing and trend data into your own financial models to replace generic benchmarks with category-specific inputs.
Mini-case — U.S. iOS subscription app: A growth manager estimating revenue for a competing productivity app uses APPRICER to check the competitor's current subscription pricing ($12.99/month annual plan, recently raised from $9.99). Without that signal, the estimate would have been materially low.
Pro Tip: Use APPRICER's subscription trend data to set your RpD inputs before running a DIY model.
The estimation mistake most analysts make
The most common error in app revenue estimation isn't using the wrong formula. It's applying a global average RpD to a U.S.-specific decision.
U.S. iOS users generate a disproportionate share of global app revenue. In mature markets like the U.S., Canada, and Japan, IAP and subscriptions account for the vast majority of revenue. Blending those into a single global RpD and applying it to a U.S. iOS app produces a number that's systematically too low, sometimes by a factor of two or more.
The second mistake is treating an estimate as a point estimate rather than a range. Every RpD benchmark carries uncertainty. The right output of any estimation process is a low/mid/high band, not a single number. Analysts who present a single figure to investors or budget committees are hiding the uncertainty, not eliminating it.
Two recommendations worth acting on now: first, measure D7 retention for your own app and use it to calibrate your LTV assumptions before you benchmark against external data. Second, triangulate across at least two independent data sources or methods before committing to a number.
APPRICER gives you sharper U.S. iOS revenue inputs
Rough benchmarks produce rough estimates. The variable that most often separates a defensible revenue projection from a guess is the quality of the RpD and pricing inputs, and that's exactly where APPRICER delivers.
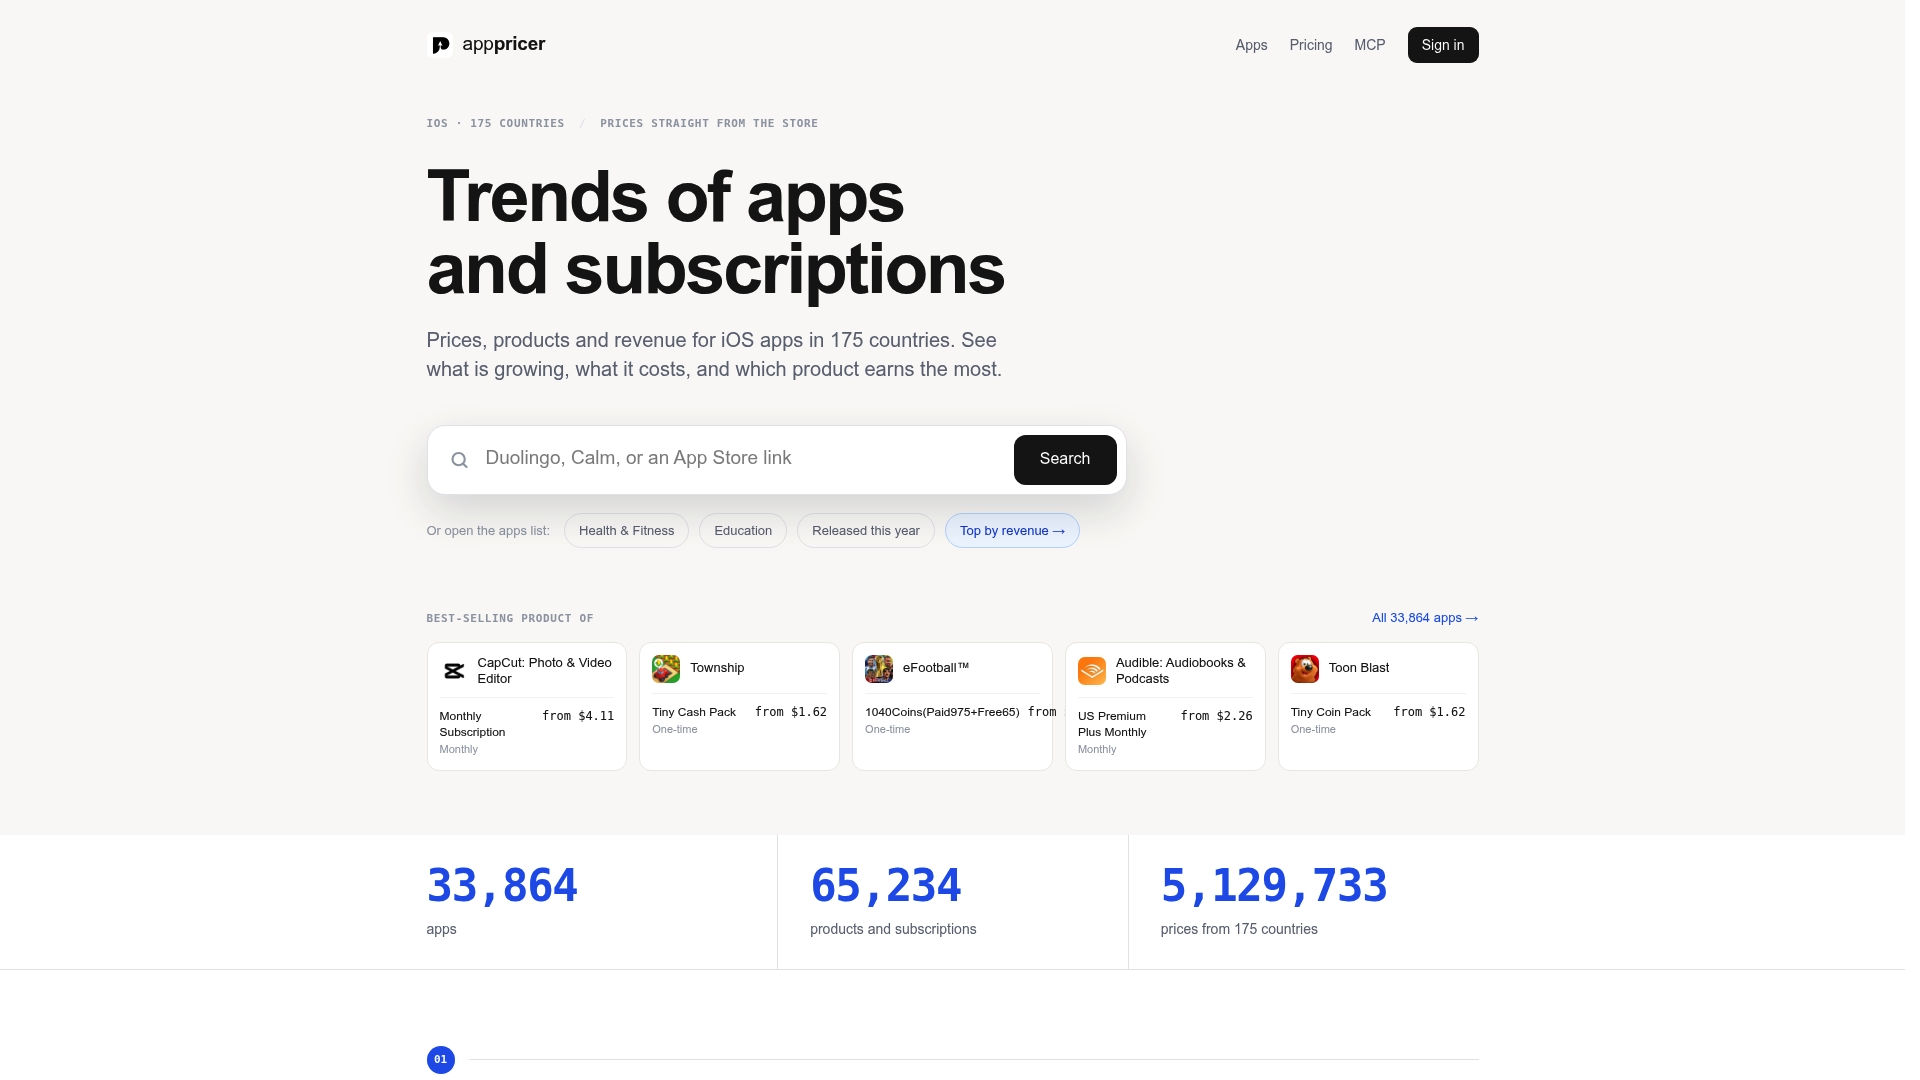
APPRICER tracks iOS app pricing, subscription configurations, and revenue trends across 175 countries, with particular depth in the U.S. market. Instead of relying on category averages from a year-old report, you get current pricing signals, competitor subscription structures, and niche growth trends that feed directly into your RpD assumptions. The result: estimates grounded in what the market is actually doing today, not what it was doing when the last industry report was published.
Comparisons are illustrative and intended for strategic decision support, not guaranteed revenue figures. Visit APPRICER to explore the database and see what current U.S. iOS pricing data looks like for your category.
Sources
- Google Play policy and payments documentation
- Pocketgamer
- How much does an app make: Adapty's ultimate app revenue & VAT guide
- Mobile App Financial Model Template, Build Free in Minutes | Revenue Map